Monitoring Clusters Using Cortex and Prometheus
In our previous blog post about Cluster API, I wrote about how we provision clusters in various data centers around the world. That's only half the story though. Once a cluster is running, you need insights into how well it works and alerting if it doesn't (sometimes described as part of "Day 2 Operations").
Cortex is an open-source project for multi-cluster, multi-tenant Prometheus. It provides users with a global view of their metrics data. Metrics are stored in long-term storage systems like AWS S3 and Google Cloud Storage (GCS).
Towards the end of last year, we decided it was time to rethink our monitoring solution.
Multi-Cluster Metrics Options
Cortex is only one possibility:
- Thanos is a very similar project providing multi-cluster, highly available Prometheus with long-term storage
- M3 is also a Prometheus compatible metrics engine
- VictoriaMetrics is another open-source time-series database and monitoring solution
- InfluxDB is another time-series platform with support for multi-cluster metrics
Additionally, there are a lot of SaaS providers like e.g. Grafana cloud available.
Flavian and I were new to metrics and never had to deploy and operate such a system. We wanted to choose Grafana cloud because it made the best impression among the SaaS offerings to us. Grafana cloud bases its pricing on the amount of active metric series. We had no clue how many active series we'll have. Luckily, there's a free trial to test it out. We signed up and targeted kube-prometheus stack to their endpoint.
After a few hours, we saw that we'd pay around USD 2'500 per month for metrics on Grafana cloud and decided to have another look at deploying a solution on our own.
Our choice was based on brief research and a few criteria we had in mind:
- Multi-cluster: handles clusters going up and down
- Windows: windows metrics exporter available (some of our rendering engines need windows)
- OSS: must be open-source software
- Data Tiers: data tiering available (cold storage)
- GCS compatible: can store in Google Cloud Storage
- Reporting: able to extract metrics for reporting/billing
- Community: active repositories and many contributors
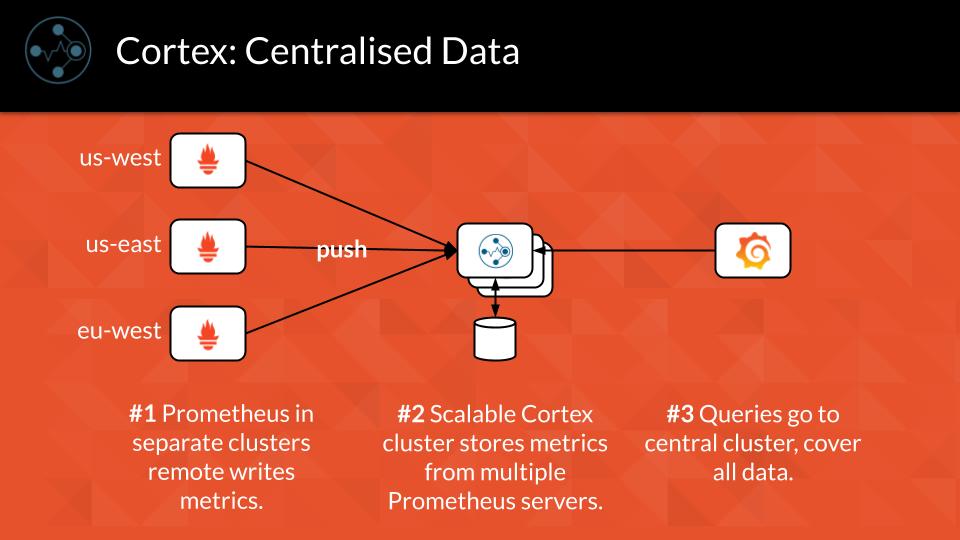
Our gut feeling leads us towards Cortex and Thanos. Both are full open-source projects without hidden pro features. They both support all our requirements. After reading a blog post comparing the two we selected Cortex because Thanos pulls data from workload clusters when querying ("Fanout Queries"). Cortex has all metrics in the main cluster and workload clusters write their data to the main cluster ("Centralised Data"). This is the better fit for our use case.
Understanding Cortex
Cortex is a complex system to deploy. A lot of components need to be deployed and configured. The documentation is extensive but not always well understandable for a newcomer, unfortunately. I think the main reason for this is the deprecation of a central piece (chunks storage) which affects the readability of the documentation. You're never quite sure if the section you're reading is deprecated or not.

The above image is from the blog post comparing Cortex and Thanos. It shows the context of Cortex. Prometheus is deployed to each cluster which should be monitored. Its remote write is configured to write to the central cortex gateway. Cortex ingests the data and writes it to backing storage (GCS in our case) in a configurable interval. Grafana queries data from the cortex querier. The querier fetches data from the ingesters (for current data) and the store-gateway (for already stored data).

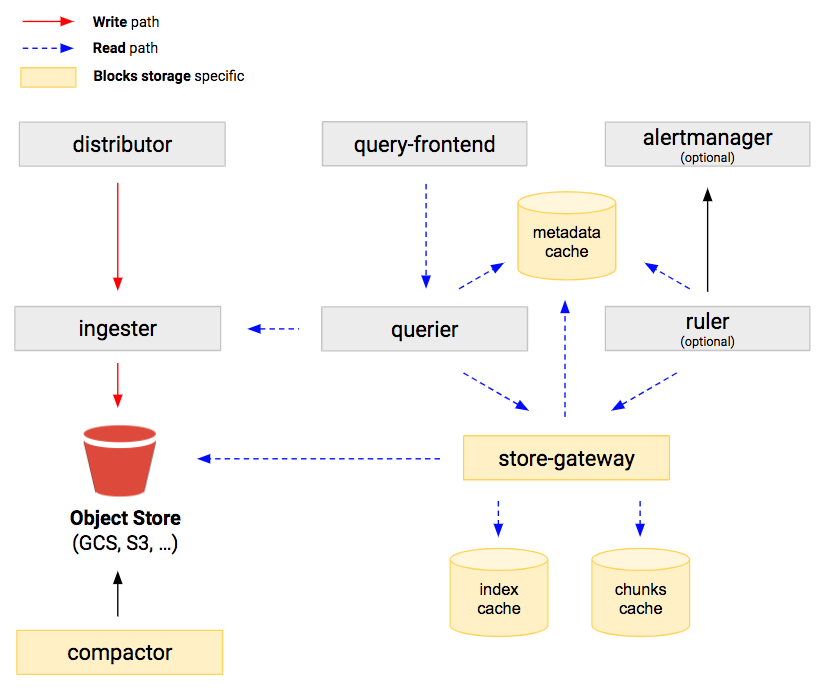
The above image (copied from the blocks storage documentation) shows the overall architecture of Cortex when using blocks storage. Let's explain the components:
- Distributor: handles incoming samples from Prometheus remote writes and dispatches them to ingesters
- Ingester: stores incoming samples into a local Time series database (TSDB). In a configurable interval, the TSDB blocks are flushed to the blocks storage.
- Compactor: compacts multiple blocks into single larger blocks. Increasing speed and reducing storage costs.
- Query-frontend: improves queries directed at querier
- Querier: handles queries in PromQL
- Store-Gateway: queries blocks from the blocks storage
- Alertmanager: takes care of sending and managing alerts, it's based on Prometheus Alertmanager
- Ruler: allows specifying recording rules for often used or complex queries which then result in new metrics samples
Cortex needs four memcached instances (blocks, blocks index, blocks metadata, frontend) additionally. If you want to deduplicate incoming samples (e.g. if you have a HA Prometheus setup in your monitored clusters) you also need to deploy Consul or etcd.
Deploying Cortex
We chose to deploy Cortex using the official helm chart and consul for the KV store.
The default values.yaml file for cortex is ~1'500 lines long and only contains a very small part of the possible configuration options. It took us about 1.5 days to get cortex running with some basic (and not safe for production use) configuration.
After deploying cortex on the monitoring cluster and Prometheus on all clusters configured with remote write: it works! 🎉
Looking at the stats, however, made us pause:
- one million active samples
- 10TB inter-zone egress (USD ~100) within 9 days
That's a lot of data to digest. We started removing a lot of ServiceMonitors to get the metrics under control again. After a bit of research, we found cortextool which can extract a regex, based on ruler and grafana dashboard usage. Grafana has a nice article documenting how that works.
After configuring the whitelisted metrics, we're now down at a baseline of ~80'000-100'000 active metric series per cluster. This is much more manageable.
Configuring Cortex
With our initial configuration we've made a lot of configuration errors:
- reused the same storage bucket for metrics as for alerts & rules
- no gRPC compression between distributor and ingester (high inter-zone traffic)
- query store times and other intervals misconfigured
- cortex config deployed as ConfigMap instead of Secret
- ingester as a Deployment instead of StatefulSet with no WAL (write-ahead log)
- ingester memory/CPU limits misconfigured
Finding all these issues and adjusting the configuration in the right way took us a while. I posted our current configuration and a diff to give you a head start.
Resource planning is very important. The ingesters consume a lot of memory. Start with sizing them generously and inspect
the metrics in an appropriate Grafana dashboard. The alerts of the cortex-mixin (see next section) help a lot. There's
also a "Cortex Scaling" dashboard in the same mixin which shows which components need scaling.
The production tips and the #cortex CNCF Slack channel are helpful, too.
Rules, Alerts, and Dashboards
To make sense of the ingested data it's important to configure necessary rules, alerts, and Grafana dashboards. We started with the basic set of rules and alerts and adjusted them. Many of those rules don't take multi-cluster support into account and we needed to add that.
The monitoring mixins provide a good source of dashboards and rules. We made our own
set of dashboards based on a number of those mixins. Especially the cortex-mixin helps discover issues with your cortex setup.
However, the helm chart doesn't work out of the box with the cortex-mixin due to the way the job label is configured.
The configuration of our cortex setup fixes this by setting relabelings on the ServiceMonitors.
The Cortex alertmanager is based upon Prometheus but can handle multiple tenants. Alerts are imported using cortextool. Using Grafana unified alerting makes sure you have a nice overview over all alerts.
Looking Back
Deploying Cortex on your own is complex. It took us a long time to get right. I'd recommend doing that only if you need it.
We learned a lot in the process and are more confident in our setup and our usage of metrics meanwhile. The self hosted setup costs us much less than a SaaS solution, long-term. Given the importance of metrics for our future needs, it's the right choice to have the knowledge in-house.
It won't be our last stack to research and deploy. Get in contact or book a call with the founders, if you would like to join us.